Home
Blog
Find & Send Cold Emails to 500 Unique Prospects Every Month for FREE.
Home
Blog
Sagar Sharma
Published December 3, 2025
19 min
Try Oppora AI
Create Self-Running Agentic Sales Workflows like N8N just by chatting with AI
Get Started for FREE
Most manufacturing teams lose deals because they chase the wrong leads for too long.
Complex buying processes, slow cycles, and technical requirements make it hard to know who’s actually ready to buy.
And, traditional qualification methods don’t help much. They miss operational needs, production issues, and engineering intent signals that matter more than generic B2B metrics.
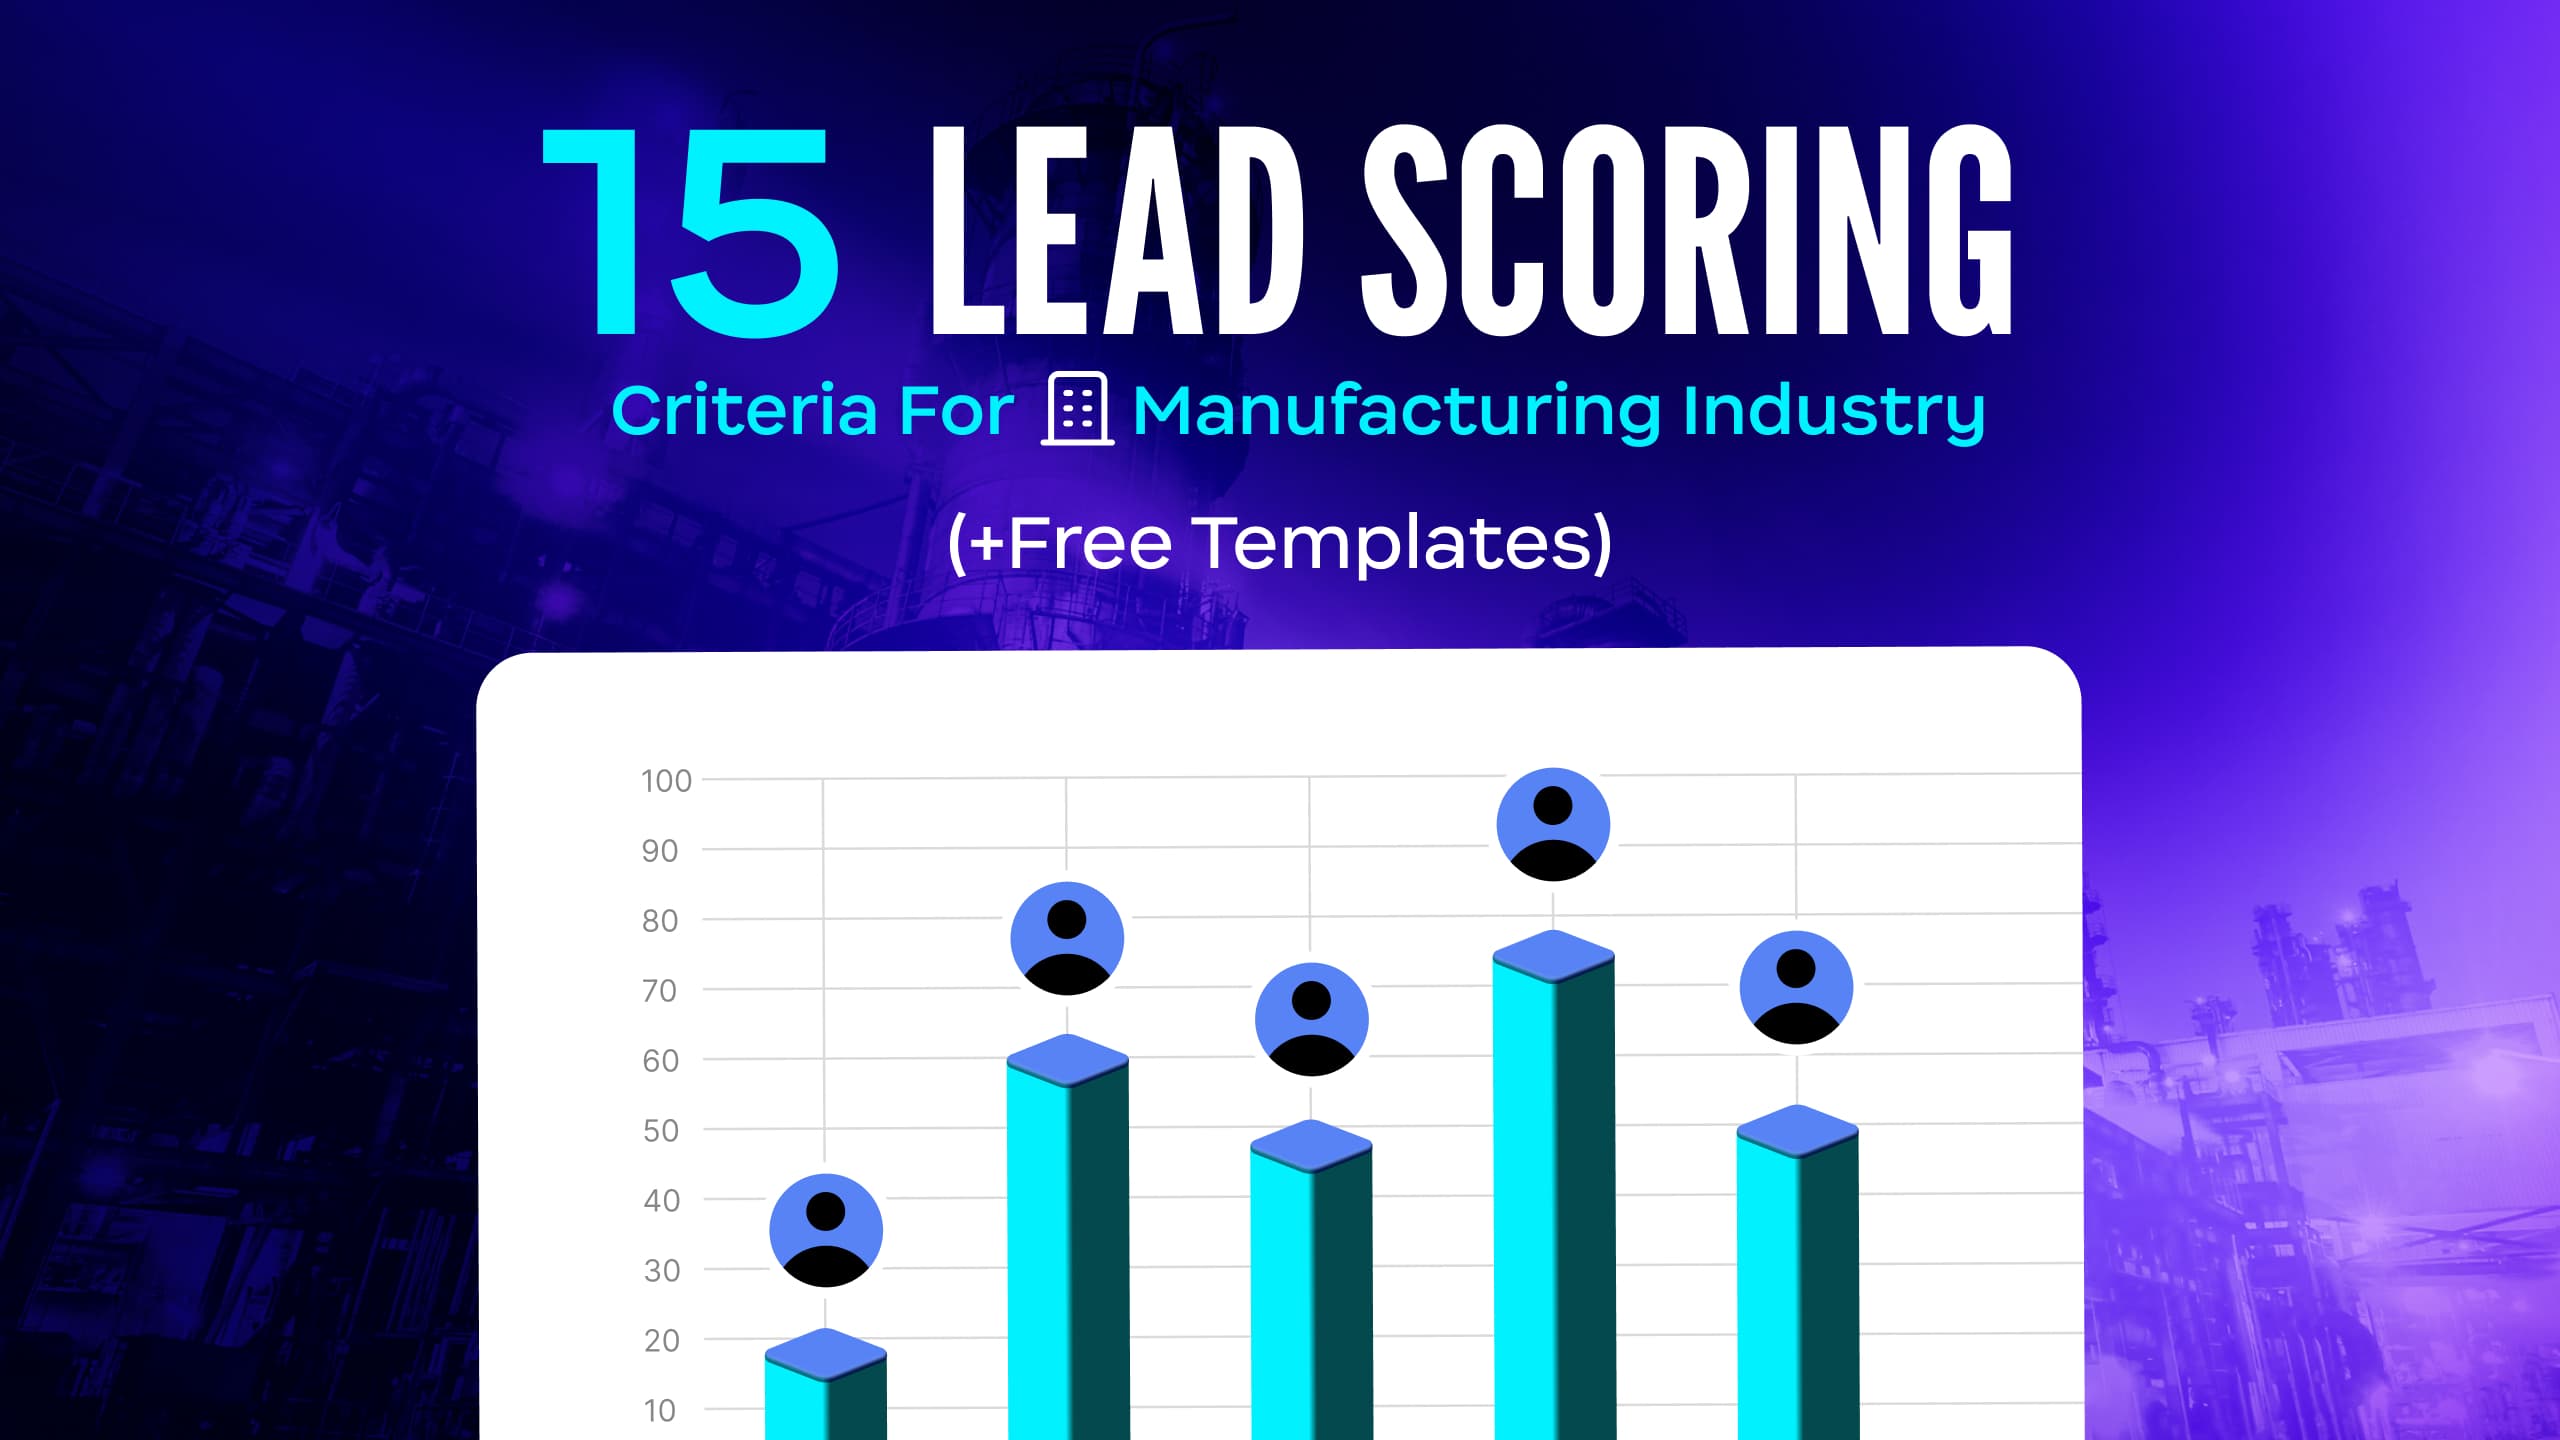
This guide specifically breaks down the lead scoring criteria for manufacturing industry teams.
You’ll get 15 practical criteria across five scoring categories and a free scorecard built for real manufacturing scenarios.
Manufacturing deals aren’t simple. They involve technical validation, long procurement loops, and operational risk. A strong scoring system helps teams spot real buyers, reduce wasted outreach, and focus on companies that match operational, financial, and technical fit. Now let’s look at why the buying cycle makes this necessary.
Manufacturing decisions rarely happen quickly. A single equipment upgrade may require engineering approval, plant manager input, procurement checks, and compliance review. Even smaller operational tools need to pass multiple hands.
That makes the buying journey slow and layered. A good manufacturing lead scoring model cuts through this by ranking leads on readiness, capability, and urgency instead of guesswork. It helps teams understand where the lead truly stands in the approval chain.
Most general B2B scoring models were built for SaaS, not factories. They ignore machinery type, plant size, CAD file downloads, breakdown events, and engineering involvement.
This is why many teams misjudge their industrial lead scoring signals. Manufacturing buyers behave differently. Their decisions are tied to operations, compliance, and production timelines. Without deeper technical and operational scoring, you end up chasing leads that look active but aren’t real buyers.
To fix this gap, you need a scoring model built for how factories actually buy.
The five core categories; Firmographics, Technographics, Behavioral Signals, Buying Triggers, and Authority, help you see whether a lead is a match, interested, researching, or under operational pressure.
Let’s break each one down.
Firmographics set the foundation for factory lead qualification because they show whether the company even fits your ideal customer profile. A small job shop behaves differently from a multi-facility OEM.
Plant size signals operational scale. Annual revenue suggests budget capacity. The number of production lines shows complexity and potential demand. Geographic distribution can also determine how implementation or servicing will work.
For example, a 300,000 sq. ft. facility running eight lines is a higher-value lead than a 20-person workshop. Firmographics help you filter early so your sellers don’t chase leads that can’t convert.
Technographics tell you how advanced a plant is and whether your solution fits their environment. The type of machines they use, their automation level, and the age of equipment reveal if they’re due for upgrades.
Software also matters. Plants running modern ERP or MES systems usually adopt new tools faster. Those still on legacy or manual processes often move slowly, but they may also have strong pain points.
For example, a plant using an outdated CNC setup and no CAD integration may be more open to process improvement than a highly automated facility. This is why technographics are key in lead scoring criteria for manufacturing operations.
Behavioral signals show what the lead is actually doing. RFQs, demo requests, and pricing interactions are strong indicators of interest. CAD file downloads or spec sheet engagement signal deeper evaluation.
These actions show that the buyer isn’t browsing casually. They’re researching options and comparing vendors.
For instance, if a prospect downloads a CAD file, views your product page twice, and replies to an email, that lead is already warm. These manufacturing buyer signals help reps prioritize leads that are moving on their own.
Buying triggers show urgency. Many factories only make changes when something forces them to. Breakdowns, capacity shortages, compliance deadlines, or sudden vendor failures immediately increase buying intent.
These events shorten sales cycles because the business needs a solution fast. A company facing a safety audit or equipment failure can’t afford long evaluation cycles.
Scoring these triggers helps you catch sales-ready leads in manufacturing industry moments when the buyer is ready to act and needs quick support.
Not all contacts are equal in manufacturing. Engineers validate specs. Plant managers care about production impact. Procurement controls budgets. Each role influences the deal in a different way.
Scoring authority helps you understand how close you are to a real decision. A conversation with a junior technician is useful but won’t move the deal. A plant manager reply means you’re talking to someone with influence.
This is essential when ranking leads because evaluating operations-ready manufacturing prospects requires identifying who actually drives the decision.
Now that the five core scoring categories are clear, the next step is applying them to real factory scenarios.
These 15 criteria turn the scoring categories into practical rules you can use to qualify leads. Each one reflects how actual manufacturing teams evaluate vendors.
So, let’s begin with scoring your leads:
Firmographics show whether a manufacturer has the right size, budget, and operational structure to be a qualified lead. These criteria help you avoid wasting time on plants that aren’t ready, can’t afford your solution, or don’t have strong use cases.
Plant size isn’t just a number on paper — it tells you how a factory actually operates.
A massive 250,000 sq. ft. facility running 24/7 thinks very differently from a 12-person workshop that opens only for two shifts.
For example, if you walk into a large automotive plant, every hour of downtime can cost them lakhs, so they’re always looking for ways to optimize performance, automate tasks, and reduce risk. But if you visit a small metal fabrication shop, the owner might say, “We’ll upgrade when this machine starts giving trouble.”
So when you score plant size, you’re really scoring budget strength, urgency, and operational maturity because big, high-throughput plants buy with scale and predictability, while smaller workshops buy only when the pain becomes real.
Decision-Making Framework
Scoring Based on ICP Selection
Revenue gives you a quick “health snapshot” of how much a manufacturer can realistically invest.
Think of it this way:
A company doing $100M+ in annual revenue usually has a dedicated improvement budget for ongoing modernization projects, consultant recommendations, and scheduled upgrade cycles.
Compare that with a $5M–$10M plant, where leadership might say, “We know we need this… but cash flow is tight. Maybe next quarter.”
By scoring revenue, you’re predicting who can pay, who can move fast, and who may need a lighter package or longer nurturing. It sets clear expectations from the very first conversation.
Decision-Making Framework
The number of lines tells you how complicated their world is.
A plant running six production lines has constant pressure to keep all of them running smoothly. If even one line slows down, the entire output suffers — so they tend to invest in tools, automation, monitoring, and process optimization without thinking twice.
On the other hand, a single-line shop behaves differently. They often say things like, “If this line is running fine, we’re okay for now.” They focus on maintenance and reliability, not big transformations.
Scoring production lines helps you understand project value, urgency, and the scale of impact your solution will have because more lines usually mean more equipment, more throughput, and bigger opportunities.
Decision-Making Framework
Technographics show how a plant runs on the equipment and systems side — their machines, automation level, and software stack. These details reveal how modern their operation is, how strong their pain points are, and how easily they can adopt a new solution. It helps you spot technical fit and upgrade urgency early, before deeper qualification.
The machines a plant runs tell you more than any website or brochure ever will. A facility using newer CNCs, robotics, automated welders, or advanced machining centers behaves very differently from a shop running mixed brands, older units, or machines held together by years of patchwork maintenance.
If a plant runs equipment that aligns with your ecosystem, the conversation moves fast. They already understand the value, integrations are easier, and operators need less training.
But if they’re running outdated or mismatched machines, the story changes. These plants often struggle with breakdowns, slow cycle times, and inconsistent output. Their pain is deeper — which means urgency is higher.
So when you score machine type, you’re not only scoring compatibility. You’re scoring technical fit, integration readiness, and how painful their operations are day to day.
Decision-Making Framework
Scoring Table (Installed Machines or Equipment Type)
Machine age is one of the clearest signs of buying readiness.
A plant using equipment older than 12–15 years typically deals with rising maintenance costs, frequent breakdowns, and unpredictable downtime. Operators know they need replacements — they’re just waiting for the right timing or the next major failure.
Plants with newer machinery still buy, but urgency is lower. Their goal is optimization, not survival.
Then you have plants in the middle — 7–10-year-old machines that still run but show aging symptoms: longer changeovers, spare parts drying up, and frequent minor stops.
Age helps you understand where the plant sits in its upgrade cycle and when the “pain curve” becomes too high to ignore.
Decision-Making Framework
Scoring Table (Age of Current Machinery / Systems)
A plant’s software stack reveals how digitally mature it really is.
If they’re using modern ERP systems, a capable MES, and updated CAD/CAM tools, they tend to move faster, budget regularly, and expect automation in their workflows. These plants integrate easier and make cleaner decisions.
Plants using outdated or homegrown systems often struggle with siloed data, manual reports, and slow decision paths. They know inefficiencies exist, but modernization feels expensive or risky — so cycles are slower.
Then there are hybrid plants: new ERP, old MES, and operators still using spreadsheets on some lines. These plants are aware of their gaps and move gradually.
Scoring the software stack helps you identify digital maturity, integration readiness, and long-term expansion potential.
Decision-Making Framework
Scoring Table (Software Stack)
Behavioral signals show how active and interested a lead really is. These actions reveal intent, evaluation depth, and whether the buyer is moving on their own.
In manufacturing, these signals matter even more because buyers research quietly and only surface when they’re serious. Scoring these behaviors helps you prioritize warm, engaged, factory lead qualification opportunities without guessing.
An RFQ is one of the strongest buying signals in manufacturing.
A plant doesn’t request pricing unless they’re actively comparing vendors or preparing for a purchase cycle. Operations teams usually submit RFQs when they’ve already identified the problem, defined the need, and validated internal approval.
Sometimes the RFQ is early-stage benchmarking. Other times it’s for immediate replacement because a machine is down, or a deadline is approaching.
Either way, an RFQ means one thing: they’re not browsing — they’re evaluating.
Decision-Making Framework
Scoring Table (RFQ Submission / Pricing Inquiry)
When someone downloads a CAD model, technical drawing, or spec sheet, it usually means one thing: engineering is involved.
This is a major signal in manufacturing lead scoring because engineers don’t waste time downloading files unless they’re checking compatibility or evaluating fit.
A CAD download often means:
This signal is far stronger than a typical website visit.
Decision-Making Framework
Scoring Table (CAD or Spec Sheet Download)
Manufacturing buyers don’t casually join demos or webinars. Engineers, plant managers, or procurement teams attend events only when they’re genuinely curious or exploring solutions for a real issue.
A demo request signals urgency. Webinar attendance shows interest and early alignment. Event booth visits reflect active exploration.
These actions show the lead is evaluating options, validating ideas, or shortlisting vendors.
Decision-Making Framework
Scoring Table (Demo / Webinar / Event Attendance)
Email activity is still one of the clearest indicators of interest in B2B manufacturing.
A simple open might mean light curiosity, but multiple opens, link clicks, or replies indicate real evaluation.
Replies matter the most.
If someone takes even 30 seconds to respond, they’re engaged enough to move forward. Clicks show research behavior. Repeated opens show internal sharing.
These are the smaller signals that help your lead scoring criteria in manufacturing industry stack feel more accurate and human.
Decision-Making Framework
Scoring Table (Email Engagement)
Buying triggers show when external pressure forces a manufacturer to act. These are moments when operational risk becomes too high to ignore.
A breakdown, a compliance audit, or a vendor failure can instantly turn a cold lead into a high-intent buyer. Scoring these triggers helps you catch manufacturing customer readiness indicators at the exact moment urgency peaks.
Few things create urgency in manufacturing like a machine going down.
If a CNC, press, robot, or filler line stops, production output drops immediately — and every hour of downtime costs money. Plants facing breakdowns move fast because they have no choice.
Even when the machine isn’t completely down, repeated maintenance issues push teams toward upgrades. Operators get frustrated, scrap rates rise, and maintenance logs start filling up with “temporary fixes.”
This trigger tells you the plant is in a pain cycle, and pain cycles drive fast decisions.
Decision-Making Framework
Scoring Table (Breakdown / Maintenance Issues)
Manufacturers must follow strict safety, quality, and environmental standards.
When a compliance deadline approaches — OSHA updates, ISO audits, FDA requirements, industry-specific certifications — plants often need new equipment, documentation systems, or process tools.
Compliance deadlines create real urgency because failure carries financial penalties, production stoppages, or certification loss.
Sometimes teams realize they’re not ready a month before an audit. Other times, an inspector flags an issue, forcing them to act immediately.
Scoring compliance pressure helps you identify leads with time-bound, non-negotiable buying timelines.
Decision-Making Framework
Scoring Table (Compliance / Regulatory Pressure)
When a manufacturer loses a vendor, faces rising costs, or experiences inconsistent delivery, they’re forced to find alternatives quickly.
A failed vendor relationship often creates an opening for new suppliers because production cannot pause.
Common triggers include:
Supply chain disruptions — especially for critical components — push manufacturers to evaluate new partners immediately.
Vendor instability is one of the fastest-moving triggers in industrial lead scoring.
Decision-Making Framework
Scoring Table (Vendor Change / Supply Chain Failure)
Authority scoring tells you how close you are to someone who can actually influence the deal. This matters in manufacturing because decisions rarely come from a single person.
Engineering checks feasibility. Plant managers validate operational impact. Procurement controls budgets. Scoring authority helps you understand who has real decision power and how fast the deal can move.
Engineering involvement is one of the clearest signals of technical readiness.
If an engineer downloads a CAD file, joins a demo, or asks for tolerances, they’re not browsing. They’re evaluating how your solution fits into their process.
In many factories, engineers play the “gatekeeper” role.
A salesperson might talk to operations or procurement first, but nothing moves until engineering confirms compatibility. When their questions shift from general (“Can this work on our line?”) to specific (“What’s the spindle speed?”), you're entering late-stage evaluation.
An engineer’s attention shows the lead is moving beyond cost conversations and into technical validation — a major step in manufacturing lead scoring readiness.
Decision-Making Framework
Scoring Table (Engineering Influence)
Procurement and plant managers are the deal accelerators — or deal stoppers.
When procurement gets involved early, it usually means leadership already approves the direction. Their questions shift toward pricing, contracts, delivery terms, and ROI.
Plant managers focus on uptime, safety, throughput, and the reality of using your solution every day. When they join the conversation, they evaluate operational impact:
“Will this slow the line?”“Will operators need training?”“Does this reduce downtime?”
Once both procurement and operations show interest, the deal is officially “real.” You’re speaking to the people who sign off.
Their involvement is one of the strongest signals in lead scoring criteria for manufacturing operations because it shows internal alignment.
Decision-Making Framework
Scoring Table (Procurement / Plant Manager)
Once you understand the signals, the next step is turning them into a scoring system your team can use every day.
The goal is simple: align sales, engineering, and operations around a common way of judging leads. A good scoring model mixes firmographics, technographics, behavioral signals, triggers, and authority — forming a complete manufacturing industry lead scoring framework that removes guesswork.
Start with your ICP.
Pick the segments you want — maybe large multi-facility plants, or mid-market manufacturers with aging equipment. Your ICP defines how much weight each criterion gets.
Then select your criteria.
Use the 15 we’ve covered: plant size, revenue, machine age, CAD downloads, RFQs, engineering involvement, and more.
Assign points.
Use the scoring tables, but adjust based on your market. If machine age matters more than revenue, give it higher weight.
Set up thresholds.
Decide what score qualifies as Hot, Warm, or Cold. Keep it simple so your team adopts it.
Validate with real deals.
Look at your past 10–20 wins. Score them. Look for patterns. Adjust weights until the scores reflect real buying behavior.
This is how manufacturing pipeline qualification methods become predictable instead of subjective.
After scoring, you need clear lead buckets. This helps SDRs and sales know what to do next.
Hot Leads
Warm Leads
Cold Leads
This approach keeps your team focused on sales-ready leads in manufacturing industry instead of chasing noise.
A scoring model isn’t static. Manufacturing changes fast — new product lines, new compliance rules, shifting budgets, and seasonal production cycles all affect buying behavior.
Update your scoring when:
Treat scoring like a living system. Your best scoring model for production-focused leads evolves with your market, not against it.
To make scoring easier, here’s a simple, ready-to-use template built for real manufacturing situations. It includes three scenarios with scorecards, weight distribution, and example totals. You can use the full version and adapt it to your own lead scoring criteria in manufacturing industry framework.
OEMs replacing or scaling automation systems have longer cycles but clearer upgrade windows. Their decisions heavily depend on engineering approval, integration fit, and throughput impact.
Interpretation: A high-fit OEM ready for automation. Engineering is active, specs are reviewed, and procurement will likely join soon.
Contract manufacturers upgrade when equipment causes downtime, slows orders, or affects customer delivery. Their cycles are shorter and often triggered by operational pain.
Interpretation: Strong operational urgency. Not deeply researched yet, but clearly evaluating replacement options.
MRO buyers switch vendors when supply chain reliability drops or pricing changes. Their cycles are fast, budget approvals are light, and vendor stability matters more than technical specs.
Interpretation:
A high-intent MRO lead with an active trigger. Vendor disruption is driving fast evaluation.
At this point, your scoring model is clear. But doing this manually takes time. You need firmographic data, technographic details, buying signals, and engagement history — and most manufacturing teams don’t have the bandwidth to collect and score everything consistently.
This is where Oppora fits in naturally.
Oppora enriches each lead automatically, verifies contacts, and pulls the core details needed for manufacturing lead scoring — plant size, revenue, equipment type, software stack, and more.
It ranks leads using AI, monitors behavioral signals, detects buying triggers, and routes hot accounts into automated outbound sequences.
So instead of spending hours researching and scoring leads manually, your team gets a ready-to-use list based on real data, with campaigns already running behind it.
By now, you’ve seen how much clearer manufacturing qualification becomes when you score leads based on real factory signals instead of generic B2B rules.
These 15 criteria across machines, plant size, engineering involvement, buying triggers, and authority give you a structure that reflects how manufacturers actually make decisions. And once you start using the scorecard, patterns become obvious and prioritization gets easier.
And if you want this to run without manual effort, Oppora can handle the scoring and the complete outreach automation for you. You can try it casually — it’s available on a free forever plan, no credit card required.
Every 6–12 months, or whenever machine types, buyer behavior, compliance rules, or product lines change. Manufacturing cycles shift fast, so scoring should reflect new triggers, seasonal patterns, and evolving equipment lifecycles.
Yes. Automation equipment, spare parts, software, and MRO supplies all follow different buying cycles. Separate scoring helps each team prioritize leads based on the signals most relevant to their product and customer profile.
Still nurture them. Many manufacturers research quietly. Keep them in low-frequency sequences until they trigger engagement through RFQs, CAD downloads, demos, or operational events.
Absolutely. Smaller plants with older machines, breakdowns, or urgent compliance deadlines often have stronger buying triggers than large OEMs with long evaluation cycles.
Score them plant-by-plant. Each facility has different machinery age, production lines, and operational issues. A company-level score often misses strong buying signals happening in individual plants.
Peak seasons reduce decision time because downtime costs more, while slow seasons allow planning and upgrades. Adjust scoring around seasonal urgency, especially for food, automotive, textiles, and electronics manufacturers.
Summarize with AI
Share